


























Table of Contents

Satellite Imagery for Crop Monitoring: Tracking Plant Health, Moisture, Stress, and Disease Risk
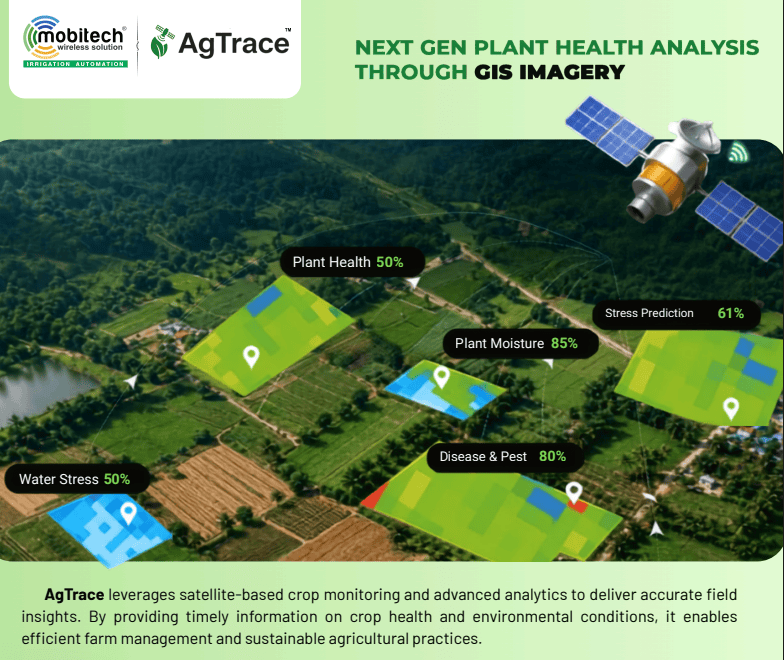
Satellite Imagery for Crop Monitoring helps farmers and agricultural teams track crop health, moisture, water stress, and vegetation changes across large farming areas. A crop field can look healthy from the ground while early signs of water stress, heat stress, nutrient imbalance, or vegetation decline are already developing in specific areas. By using satellite imagery and remote sensing, farmers can monitor these changes spatially, compare crop conditions over time, and identify areas that need closer attention.
Why Crop Monitoring Needs More Than a Field Visit
Traditionally, crop monitoring depends heavily on walking through the farm, observing leaves, checking soil conditions, and responding when visible symptoms appear. This approach remains important, but it becomes difficult when the farm covers a large area.
A farmer may notice that one part of the field is performing differently from another only after the variation becomes visually obvious. By that stage, the underlying issue may have already affected plant growth.
Satellite imagery for crop monitoring provides another layer of information. Instead of looking at only individual plants, remote sensing can analyse patterns across larger field areas and reveal changes that may not be immediately visible from ground level.
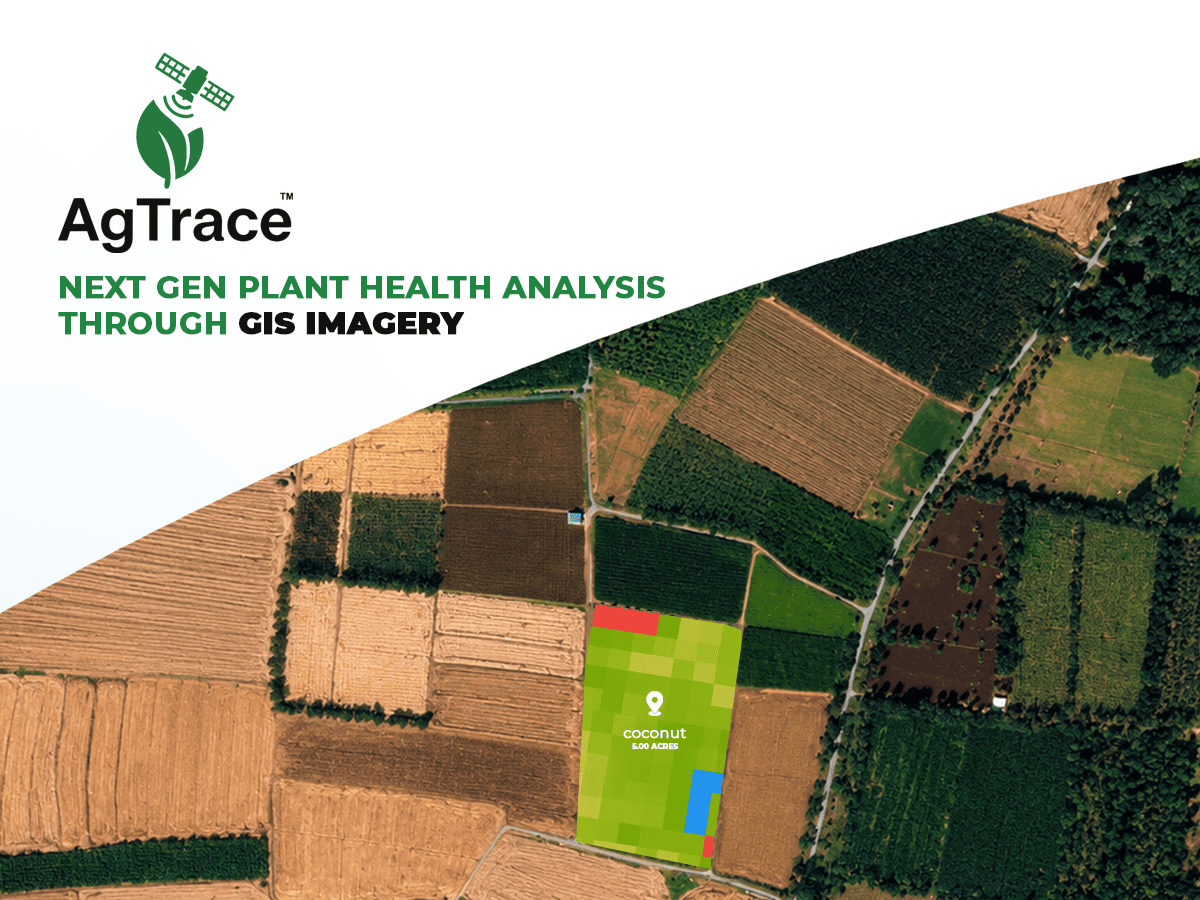
Satellite and GIS-based analysis can turn complex field data into maps that are easier to interpret and act upon.
What Can Satellite Imagery Reveal About a Crop?
Plants interact with sunlight in ways that contain useful information about their condition. Healthy vegetation absorbs certain wavelengths and reflects others. Remote sensing systems can capture these spectral differences and convert them into measurable indicators of vegetation condition.
This means crop monitoring does not have to depend only on what the human eye can see. Changes in vegetation reflectance, moisture-related signals, and canopy conditions can provide additional information for analysing field variability.
Plant Health
Analyse vegetation condition and crop vigour across different parts of a field.
Moisture
Identify areas showing signs of declining moisture and potential drying trends.
Crop Stress
Track patterns associated with water deficiency, heat and other physiological stress factors.
Disease Risk
Highlight unusual vegetation patterns that may require field scouting and investigation.
Detecting Crop Moisture Stress Across the Field
Water stress does not always affect an entire farm equally. Soil characteristics, irrigation coverage, drainage, terrain, crop density and weather conditions can create different moisture zones within the same field.
Ag Trace uses moisture-related metrics such as the Normalized Difference Water Index (NDWI) and Moisture Stress Index to help identify areas where crop moisture conditions may be changing.
What this can help identify:
- Rapidly drying areas
- Low-moisture zones
- Changes in moisture patterns across the farm
- Areas that may need closer irrigation assessment
From Moisture Maps to Targeted Irrigation
The value of crop monitoring is not simply producing a colourful map. The real value comes from using the information to support better field decisions.
If a large farm contains both adequately moist and rapidly drying zones, applying the same irrigation strategy everywhere may not always reflect the actual field conditions. Spatial moisture information can help identify areas that deserve additional investigation or irrigation attention.
Locate
Find areas showing lower moisture conditions.
Investigate
Verify the field condition and possible causes.
Respond
Use the information to support targeted irrigation planning.
Finding Stress Before It Becomes Obvious
Crop stress can develop for several reasons. Water deficiency and heat are common examples, but nutrient imbalance, toxicity, soil salinity, root-zone problems and extreme weather events can also influence plant performance.
Ag Trace analyses changes such as reduced near-infrared reflectance and canopy-temperature anomalies to identify early physiological stress patterns.
Heat Stress
Nutrient Imbalance
Soil Salinity
Root-Zone Damage
Weather Recovery
Turning Spectral Information Into Crop Health Insights
Healthy vegetation interacts with electromagnetic radiation differently from stressed vegetation.
Satellite and GIS imagery can capture spectral information that is difficult to interpret through ordinary visual observation. Ag Trace uses these patterns to calculate vegetation indicators that help analyse crop greenness and photosynthetic activity.
Relative Health Maps
Field areas can be categorised into relative health bands such as Poor, Fair, Good and Excellent.
Vigor Comparisons
Different fields or crop zones can be compared to understand variations in crop performance.
Temporal Trends
Multiple dates can be compared to determine whether crop conditions are improving, stable or declining.
Crop-Zone Analysis
Spatial differences can help focus field scouting and crop-management attention where it matters most.
Can Satellite Imagery Detect Crop Disease?
Satellite imagery and remote sensing should not be treated as a replacement for agronomists or field diagnosis. Different problems can sometimes create similar vegetation patterns.
Instead, Ag Trace works as an early-detection and scouting tool. It can identify unusual vegetation anomalies that deserve closer field inspection rather than claiming to definitively identify a particular pathogen or insect species.
Examples of anomalies that may require investigation
- Localized chlorosis
- Abnormal canopy reflectance
- Patchy vegetation decline
From Anomaly Detection to Field Scouting
One of the practical advantages of spatial crop monitoring is that it can help direct field teams toward specific locations instead of requiring them to inspect a large farm without a clear starting point.
STEP 1 — Detect
Identify an unusual vegetation pattern from imagery.
STEP 2 — Map
Locate the affected zone or coordinates on a digital map.
STEP 3 — Scout
Send the field team to inspect the highlighted area.
STEP 4 — Monitor
Use subsequent imagery to observe whether the anomaly is stable, improving or spreading.
Why Monitoring Crop Health Over Time Matters
A single satellite image provides a snapshot. Agricultural decisions often require a timeline.
By comparing imagery from multiple dates, farmers and agricultural teams can observe whether a crop zone is improving, remaining stable, or showing a continuing decline. Ag Trace provides temporal trend analysis for this purpose.
Baseline
Change
Investigation
Follow-up
What Can Farmers Do With Crop Monitoring Insights?
The purpose of satellite-based crop monitoring is not to replace practical farm knowledge. It is to give that knowledge another source of spatial information.
Irrigation Planning
Identify moisture variability that can support more targeted irrigation assessment.
Field Scouting
Direct field teams toward zones showing unusual vegetation behaviour.
Crop Comparison
Compare crop vigour between different fields or management zones.
Seasonal Monitoring
Track how crop conditions change across multiple observation dates.
MOBITECH AG TRACE
A GIS-Based Approach to Plant Health Monitoring
Ag Trace combines imagery-based analysis with spatial crop monitoring to help agricultural teams understand plant health, moisture conditions, stress patterns and areas requiring field investigation.
Stress Monitoring
Track indicators associated with water deficiency, heat, nutrient imbalance, salinity and other stress factors.
Moisture Assessment
Analyse moisture-related patterns and identify areas showing signs of rapid drying.
Health & Risk Maps
Generate relative health maps, suspected problem areas and scouting zones for field investigation.
Key Outputs of Satellite-Based Crop Monitoring
| Monitoring Area | What It Helps Show | Potential Field Action |
|---|---|---|
| Plant Health | Relative crop vigour and vegetation condition | Compare zones and investigate weaker areas |
| Moisture | Low-moisture and drying patterns | Review irrigation requirements |
| Stress | Possible physiological stress patterns | Inspect affected crop zones |
| Disease / Pest Risk | Unusual vegetation anomalies | Prioritise field scouting |
| Time-Series Change | Improving, stable or declining patterns | Monitor progression and response |
Important:
Satellite imagery is an observation and decision-support tool, not a substitute for field verification. A detected anomaly can have multiple possible causes. Ground inspection, agronomic knowledge and other available farm data should be used to understand the actual cause before taking corrective action.
Conclusion: Moving From Visual Observation to Data-Assisted Crop Monitoring
Modern crop monitoring is moving beyond simply asking whether a field looks green. Farmers increasingly need to understand where crop conditions are changing, how quickly they are changing, and which areas deserve closer attention.
Satellite imagery and GIS-based analysis provide a way to observe these spatial patterns across large agricultural areas. Plant health indicators can help reveal variations in crop vigour, moisture-related metrics can highlight drying zones, and stress analysis can identify areas requiring investigation.
Ag Trace brings these capabilities together through plant health analysis, moisture assessment, stress monitoring, relative health mapping, temporal trend analysis and anomaly-based scouting support. The result is not simply another farm map—it is an additional information layer that can help connect what is happening in the field with where it is happening.
The goal is simple:
identify changes earlier, locate them more precisely, verify them in the field, and use better information to support crop-management decisions.
Want Better Visibility Into Your Crop?
Explore Ag Trace for GIS-based plant health analysis, crop stress monitoring, moisture assessment and field scouting support.
If you have any questions about this , kindly fill in the form below.
What is Satellite Imagery for Crop Monitoring?
Satellite Imagery for Crop Monitoring uses satellite images and remote sensing data to monitor crop health, moisture, vegetation changes, and crop stress across agricultural fields.
How does satellite imagery help farmers?
It helps farmers monitor large areas, identify crop stress, observe moisture variations, and find areas that may need closer field inspection or irrigation attention.
What can satellite imagery monitor in crops?
It can support monitoring of crop health, moisture conditions, water stress, vegetation changes, crop development, and field conditions over time.
How to monitor crop health using satellites?
Satellite imagery can monitor crop health by analysing vegetation patterns, moisture conditions, crop stress, and changes in field conditions over time.
What are the benefits of satellite imagery for crop monitoring?
It can support large-area monitoring, early identification of crop stress, time-based comparisons, irrigation planning, and more informed farm management decisions.